
Why one number won’t tell you much
Search “solar panel cost Illinois” and most pages hand you a single confident figure. Cost varies enough by system size, equipment, roof complexity, and installer that a single number tends to mislead more than help. What’s more useful is understanding the range, why different sources report different numbers, and how the incentive picture, which changed meaningfully in the past two years, factors into the payback math.
Three sources, three different numbers, and why that’s not a contradiction
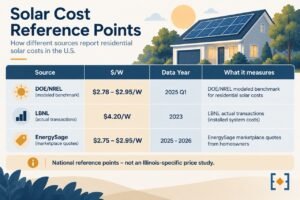
The Department of Energy and the National Renewable Energy Laboratory publish a modeled cost benchmark based on Q1 2025 data, expressed in 2024 dollars: for a residential system without storage, that benchmark runs $2.78 per watt at the minimum sustainable price model up to $2.95 per watt at the modeled market price. This figure represents a modeled, bottom-up estimate of what an efficient market should charge, not a record of what people actually paid.
Lawrence Berkeley National Laboratory’s Tracking the Sun report takes a different approach: it analyzes roughly 3.2 million actual installed systems nationally and reports a median residential price of $4.20 per watt for 2023 installations, the most recent year in that dataset. That figure reflects real transactions, not a modeled benchmark, which is a meaningful part of why it lands higher than NREL’s figure.
Online marketplace quote data from sources like EnergySage runs closer to the NREL benchmark, in the range of roughly $2.75 to $2.95 per watt for 2025-2026 quotes, though that reflects competitive online-sourced pricing specifically, not the full range of installation channels homeowners actually use.
None of these three is wrong. They’re measuring different things: a modeled benchmark, a broad sample of real transactions, and a specific online marketplace channel, and all three are national figures. None of them is an Illinois-specific price study, and none establishes what a system costs in Illinois specifically today. They’re useful as reference points for understanding why cost estimates vary so much depending on the source, not as a substitute for a number built around an actual Illinois project.
What used to shrink that number, and doesn’t anymore
Until the end of 2025, the federal tax credit cut 30 percent off the upfront cost for anyone who qualified. That credit ended for systems placed in service in 2026 and later. If an older article’s cost example assumes a federal credit, it’s describing a different financial picture than a 2026 Illinois installation.
What still affects the number in 2026
Illinois Shines still purchases the renewable energy credit value from a system’s generation, typically handled through an Approved Vendor as part of the installation, and how that value reaches a homeowner depends on the specific vendor’s contract terms. Net metering or net billing credits from the utility also factor in, and those rules differ by whether the account is served by ComEd or Ameren and when the system was interconnected. None of these can be estimated in general terms. They depend on your utility, system size, and the current program year.
A framework, not a number
Rather than a fabricated worked example, here’s what a real payback estimate actually needs to account for:
- Installed cost for the specific system size and equipment chosen
- Illinois Shines REC value as structured by the Approved Vendor
- Ongoing utility crediting under the applicable net metering or net billing arrangement
- The household’s actual electricity usage and rate
Any one of these can shift an estimate by years. A project-specific quote is an important input for getting this right, since it reflects your actual roof and equipment choice, though utility rate data and program documentation are also legitimate parts of building a complete picture, and a homeowner willing to do the research can pull some of this together independently.
Request your solar quote through SolarSiteIQ to see real numbers built around your home instead of a modeled national average.
Frequently asked questions
What’s a typical cost range for a home solar system in Illinois?
There isn’t a current Illinois-specific study this article can point to. What exists are national reference points, roughly $2.78 to $4.20 per watt before incentives depending on the source and methodology, that show the general scale of installed cost but don’t establish an Illinois number. System size, equipment, and installer will move an actual Illinois project within, above, or below that national range.
Is the federal tax credit factored into that range?
No. All of these figures reflect installed cost before incentives. The federal residential credit ended for systems placed in service after 2025.
Why won’t this article just give me a payback period?
Because a responsible estimate depends on your system size, your utility’s current crediting rules, and the current Illinois Shines program year, none of which a general article can know about your specific home.
